 Stream design curves are created by analyzing the morphology of a statistically significant number of stable streams and plotting the data. The data gathered, typically bankfull width, bankfull height, and sinuosity, is then plotted against drainage area to demonstrate the correlation between the various channel characteristics and the hydrology of the region. The trend line can then be used by designers and managers to provide initial channel measurements for a stream restoration project.
The development and use of regional curves by fluvial geomorphologists began in the 1950’s by Luna Leopold. This work indicated that it is common for there to be strong correlations between channel shapes, discharges and drainage areas. After Leopold published design curves for the San Francisco Bay area in 1978, it became clear that this region needed more data at the sub-regional level. A number of hydrogeomorphologists in the bay area have since worked to improve the accuracy and precision at the sub-regional scale.
The user of a regional curve, when used appropriately, can acquire meaningful initial estimates of the average channel shapes for streams in that region based on drainage area. This is useful to the restoration designer or public works official who wants to know if a stream reach of concern has a cross-sectional area which is close to, or far off from the the regional average. This comparison can provide insight to the stability of the reach. “Stability” in this context means that the channel is not excessively eroding or depositing sediment but has dynamic meandering, sediment transport and erosion to build pools, riffles, step-pools and other instream complexity. The regional curves can be very helpful in determining “equilibrium” channel shapes for stream reaches for which there are not nearby reference reaches in good condition to help inform a stream channel restoration .
If these design curves are used to inform a channel design, it is necessary to incorporate additional information into determining an equilibrium channel shape. These design tools can include the more complex dimensionless rating curves, and computations of effective discharges which form the channels. Some stream channel types are not conducive to being represented by regional curves such as streams located in alluvial fans, channels just upstream of marshes, or channels in steep areas of a watershed.[toggle_box] [toggle_item title=”Background” active=”false”]In 1978 a regional curve was published for the Bay Area by Dunne and Leopold and included information from most of the Bay Area counties. Because the Bay Area has so many different micro climates, it is necessary to develop curves which represent these different sub-regional environments to ensure designers have the most applicable data available. For this reason the EPA and SFEP are supporting the development of regional curves which represent the conditions found in the different sub-regions of the Bay. Developed urban environments that have not experienced much land use change in the past few decades can benefit from developing curves representing a built out urban equilibrium. Areas in process of undergoing land use changes are not good candidates for developing the curves.[/toggle_item] [/toggle_box] [tab] [tab_item title=”Design Resources”]
Design Primer by Anne Riley (San Francisco Bay Water Quality Control Board)
Original San Francisco Bay Regional Curve
[/tab_item] [tab_item title=”North Bay”]By Ariel Rubissow Okamoto
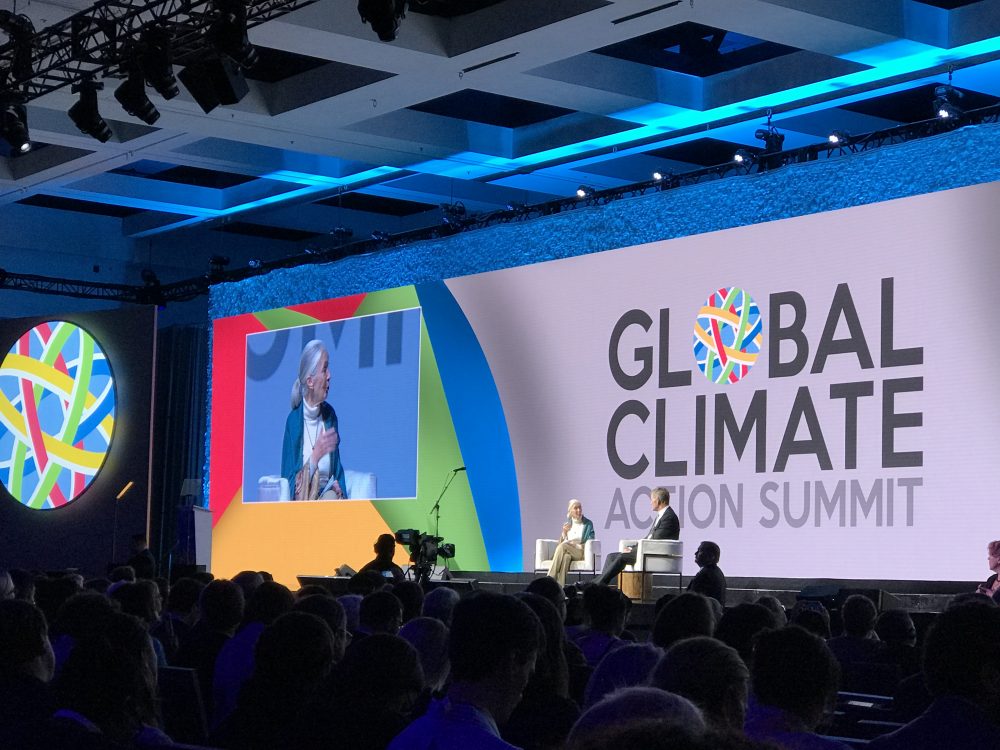
Nothing could be stranger than sitting in the dark with thousands of suits and heels, watching a parade of promises to decarbonize from companies and countries large and small, reeling from the beauties of big screen rainforests and indigenous necklaces, and getting all choked up.
It was day two of the September 2018 Global Climate Action Summit in San Francisco when I felt it.
At first I wondered if I was simply starstruck. Most of us labor away trying to fix one small corner of the planet or another without seeing the likes of Harrison Ford, Al Gore, Michael Bloomberg, Van Jones, Jerry Brown – or the ministers or mayors of dozens of cities and countries – in person, on stage and at times angry enough to spit. And between these luminaries a steady stream of CEOs, corporate sustainability officers, and pension fund managers promising percentages of renewables and profits in their portfolios dedicated to the climate cause by 2020-2050.
I tried to give every speaker my full attention: the young man of Vuntut Gwichin heritage from the edge of the Yukon’s Arctic National Wildlife Refuge who pleaded with us not to enter his sacred lands with our drills and dependencies; all the women – swathed in bright patterns and head-scarfs – who kept punching their hearts. “My uncle in Uganda would take 129 years to emit the same amount of carbon as an American would in one year,” said Oxfam’s Winnie Byanyima.
“Our janitors are shutting off the lights you leave on,” said Aida Cardenas, speaking about the frontline workers she trains, mostly immigrants, who are excited to be part of climate change solutions in their new country.
The men on the stage, strutting about in feathers and pinstripes, spoke of hopes and dreams, money and power. “The notion that you can either do good or do well is a myth we have to collectively bust,” said New Jersey Governor Phil Murphy whose state is investing heavily in offshore wind farms.
“Climate change isn’t just about risks, it’s about opportunities,” said Blackrock sustainable investment manager Brian Deese.
But it wasn’t all these fine speeches that started the butterflies. Halfway through the second day of testimonials, it was a slight white-haired woman wrapped in an azure pashmina that pricked my tears. One minute she was on the silver screen with Alec Baldwin and the next she taking a seat on stage. She talked about trees. How trees can solve 30% of our carbon reduction problem. How we have to stop whacking them back in the Amazon and start planting them everywhere else. I couldn’t help thinking of Dr. Seuss and his truffala trees. Jane Goodall, over 80, is as fierce as my Lorax. Or my daughter’s Avatar.
Analyzing my take home feeling from the event I realized it wasn’t the usual fear – killer storms, tidal waves, no food for my kids to eat on a half-baked planet – nor a newfound sense of hope – I’ve always thought nature will get along just fine without us. What I felt was relief. People were actually doing something. Doing a lot. And there was so much more we could do.
As we all pumped fists in the dark, as the presentations went on and on and on because so many people and businesses and countries wanted to STEP UP, I realized how swayed I had let myself be by the doomsday news mill.
“We must be like the river, “ said a boy from Bangladesh named Risalat Khan, who had noticed our Sierra watersheds from the plane. “We must cut through the mountain of obstacles. Let’s be the river!”
Or as Harrison Ford less poetically put it: “Let’s turn off our phones and roll up our sleeves and kick this monster’s ass.”
by Isaac Pearlman
Since California’s last state-led climate change assessment in 2012, the Golden State has experienced a litany of natural disasters. This includes four years of severe drought from 2012 to 2016, an almost non-existent Sierra Nevada snowpack in 2014-2015 costing $2.1 billion in economic losses, widespread Bay Area flooding from winter 2017 storms, and extremely large and damaging wildfires culminating with this year’s Mendocino Complex fire achieving the dubious distinction of the largest in state history. California’s most recent climate assessment, released August 27th, predicts that for the state and the Bay Area, we can expect even more in the future.
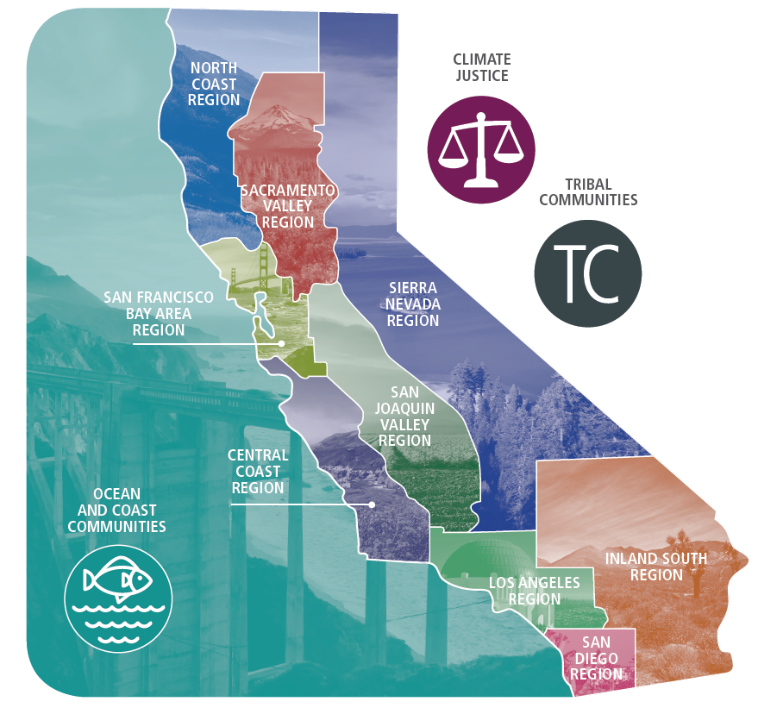
The California state government first began assessing climate impacts formally in 2006, due to an executive order by Governor Schwarzenegger. California’s latest iteration and its fourth overall, includes a dizzying array of 44 technical reports; three topical studies on climate justice, tribal and indigenous communities, and the coast and ocean; as well as nine region-specific analyses.
 The results are alarming for our state’s future: an estimated four to five feet of sea level rise and loss of one to two-thirds of Southern California beaches by 2100, a 50 percent increase in wildfires over 25,000 acres, stronger and longer heat waves, and infrastructure like airports, wastewater treatment plants, rail and roadways increasingly likely to suffer flooding.
For the first time, California’s latest assessment dives into climate consequences on a regional level. Academics representing nine California regions spearheaded research and summarized the best available science on the variable heat, rain, flooding and extreme event consequences for their areas. For example, the highest local rate of sea level rise in the state is at the rapidly subsiding Humboldt Bay. In San Diego county, the most biodiverse in all of California, preserving its many fragile and endangered species is an urgent priority. Francesca Hopkins from UC Riverside found that the highest rate of childhood asthma in the state isn’t an urban smog-filled city but in the Imperial Valley, where toxic dust from Salton Sea disaster chokes communities – and will only become worse as higher temperatures and less water due to climate change dry and brittle the area.
According to the Bay Area Regional Report, since 1950 the Bay Area has already increased in temperature by 1.7 degrees Fahrenheit and local sea level is eight inches higher than it was one hundred years ago. Future climate will render the Bay Area less suitable for our evergreen redwood and fir forests, and more favorable for tolerant chaparral shrub land. The region’s seven million people and $750 billion economy (almost one-third of California’s total) is predicted to be increasingly beset by more “boom and bust” irregular wet and very dry years, punctuated by increasingly intense and damaging storms.
Unsurprisingly, according to the report the Bay Area’s intensifying housing and equity problems have a multiplier affect with climate change. As Bay Area housing spreads further north, south, and inland the result is higher transportation and energy needs for those with the fewest resources available to afford them; and acute disparity in climate vulnerability across Bay Area communities and populations.
“All Californians will likely endure more illness and be at greater risk of early death because of climate change,” bluntly states the statewide summary brochure for California’s climate assessment. “[However] vulnerable populations that already experience the greatest adverse health impacts will be disproportionately affected.”
“We’re much better at being reactive to a disaster than planning ahead,” said UC Berkeley professor and contributing author David Ackerly at a California Adaptation Forum panel in Sacramento on August 27th. “And it is vulnerable communities that suffer from those disasters. How much human suffering has to happen before it triggers the next round of activity?”
The assessment’s data is publicly available online at “Cal-adapt,” where Californians can explore projected impacts for their neighborhoods, towns, and regions.