As the Estuary faces drowning marshes due to rising seas, people want to see action – acres saved, walls built, marsh mice whisked to safety after crawling to the tip of the tallest gumplant. In terms of action, “sediment monitoring” doesn’t come immediately to mind. Monitoring is something you do after all the action is over, isn’t it? And as for “sediment,” well what’s all the fuss over some dirt and mud?
In fact, there is quite a fuss. The Bay region has a sediment management strategy and a sediment monitoring and modeling strategy, and later this month it will have a new sediment supply and demand analysis. Indeed, six different workgroups of Bay scientists, managers, and regulators are now deeply stuck into studying sediment, how much of it there is in San Francisco Bay, where it comes from and goes to, and more importantly, whether we have enough to elevate our marshes and shorelines above rising sea levels. The advancing Pacific has given sediment top billing on the Bay research marquee; it’s the monitoring part, however, that will help us make every grain count.
“The science is telling us the rate of sea-level rise is getting faster, and we probably won’t have enough natural sediment in the Estuary to keep up,” says Scott Dusterhoff, a geomorphologist with the San Francisco Estuary Institute and lead scientist for the San Francisco Bay Regional Monitoring Program (RMP) Sediment Workgroup.
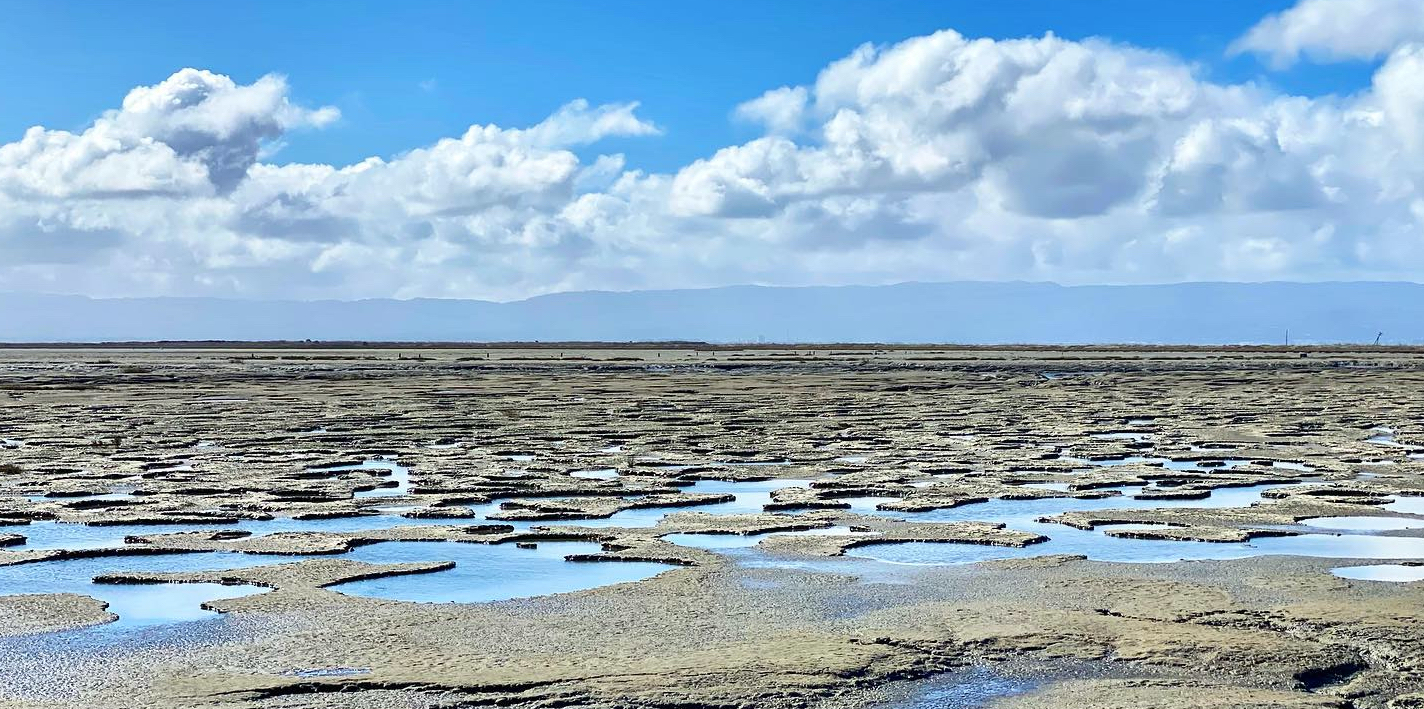
Low tide on the Eden Landing mudflats in the South Bay. Photo: Robin Meadows.
“We’re seeing signs of marshes eroding and drowning right now, not on some future horizon,” adds Xavier Fernandez, an environmental scientist with the San Francisco Bay Regional Water Quality Control Board — “so we need to move more sediment onto the marshes right away, otherwise we’ll lose them and habitat for species we care about.” Estimates suggest the region’s marshes and mudflats need 400-600 million tons of sediment in the future to remain ecologically functional through to the year 2100: now that’s a lot of sediment!
And while these alarming facts may seem like the headliner, they’re really just the warmup act. The real news is that regional managers and scientists have done their homework and figured out who is doing what in terms of critical research and what our priorities should be to fill the knowledge gaps before it’s too late. An RMP workgroup released this homework – a Sediment Monitoring and Modeling Strategy – late last year.
Placing sediment monitoring instruments in the Bay shallows. Photo: USGS
To get a better handle on research gaps and priorities, the homework involved comparing a variety of management questions about sediment coming from different agencies and activities; as well as summarizing all that is currently known about how sediment in the Bay is impacted by hydrology and geomorphology, dams and flood control channels, rainfall and fault lines in watersheds, and polar and tropical weather patterns affecting coastal processes, not to mention tides, urban development along the shore, and other factors. Among 12 priority recommendations made by the group for study over the next five years, several emerged as needing more detail, more data, or more complex computer modeling sooner rather than later.
“We don’t have a closed sediment budget for the whole Bay for both fine and coarse material,” says Lester McKee, one of the Institute’s lead sediment researchers, who coauthored the monitoring and modeling strategy with Dusterhoff. “We know how much comes in and from where but we’re lacking information on how much is stored or eroded from the Bay bed, and how much is going out the Golden Gate.”
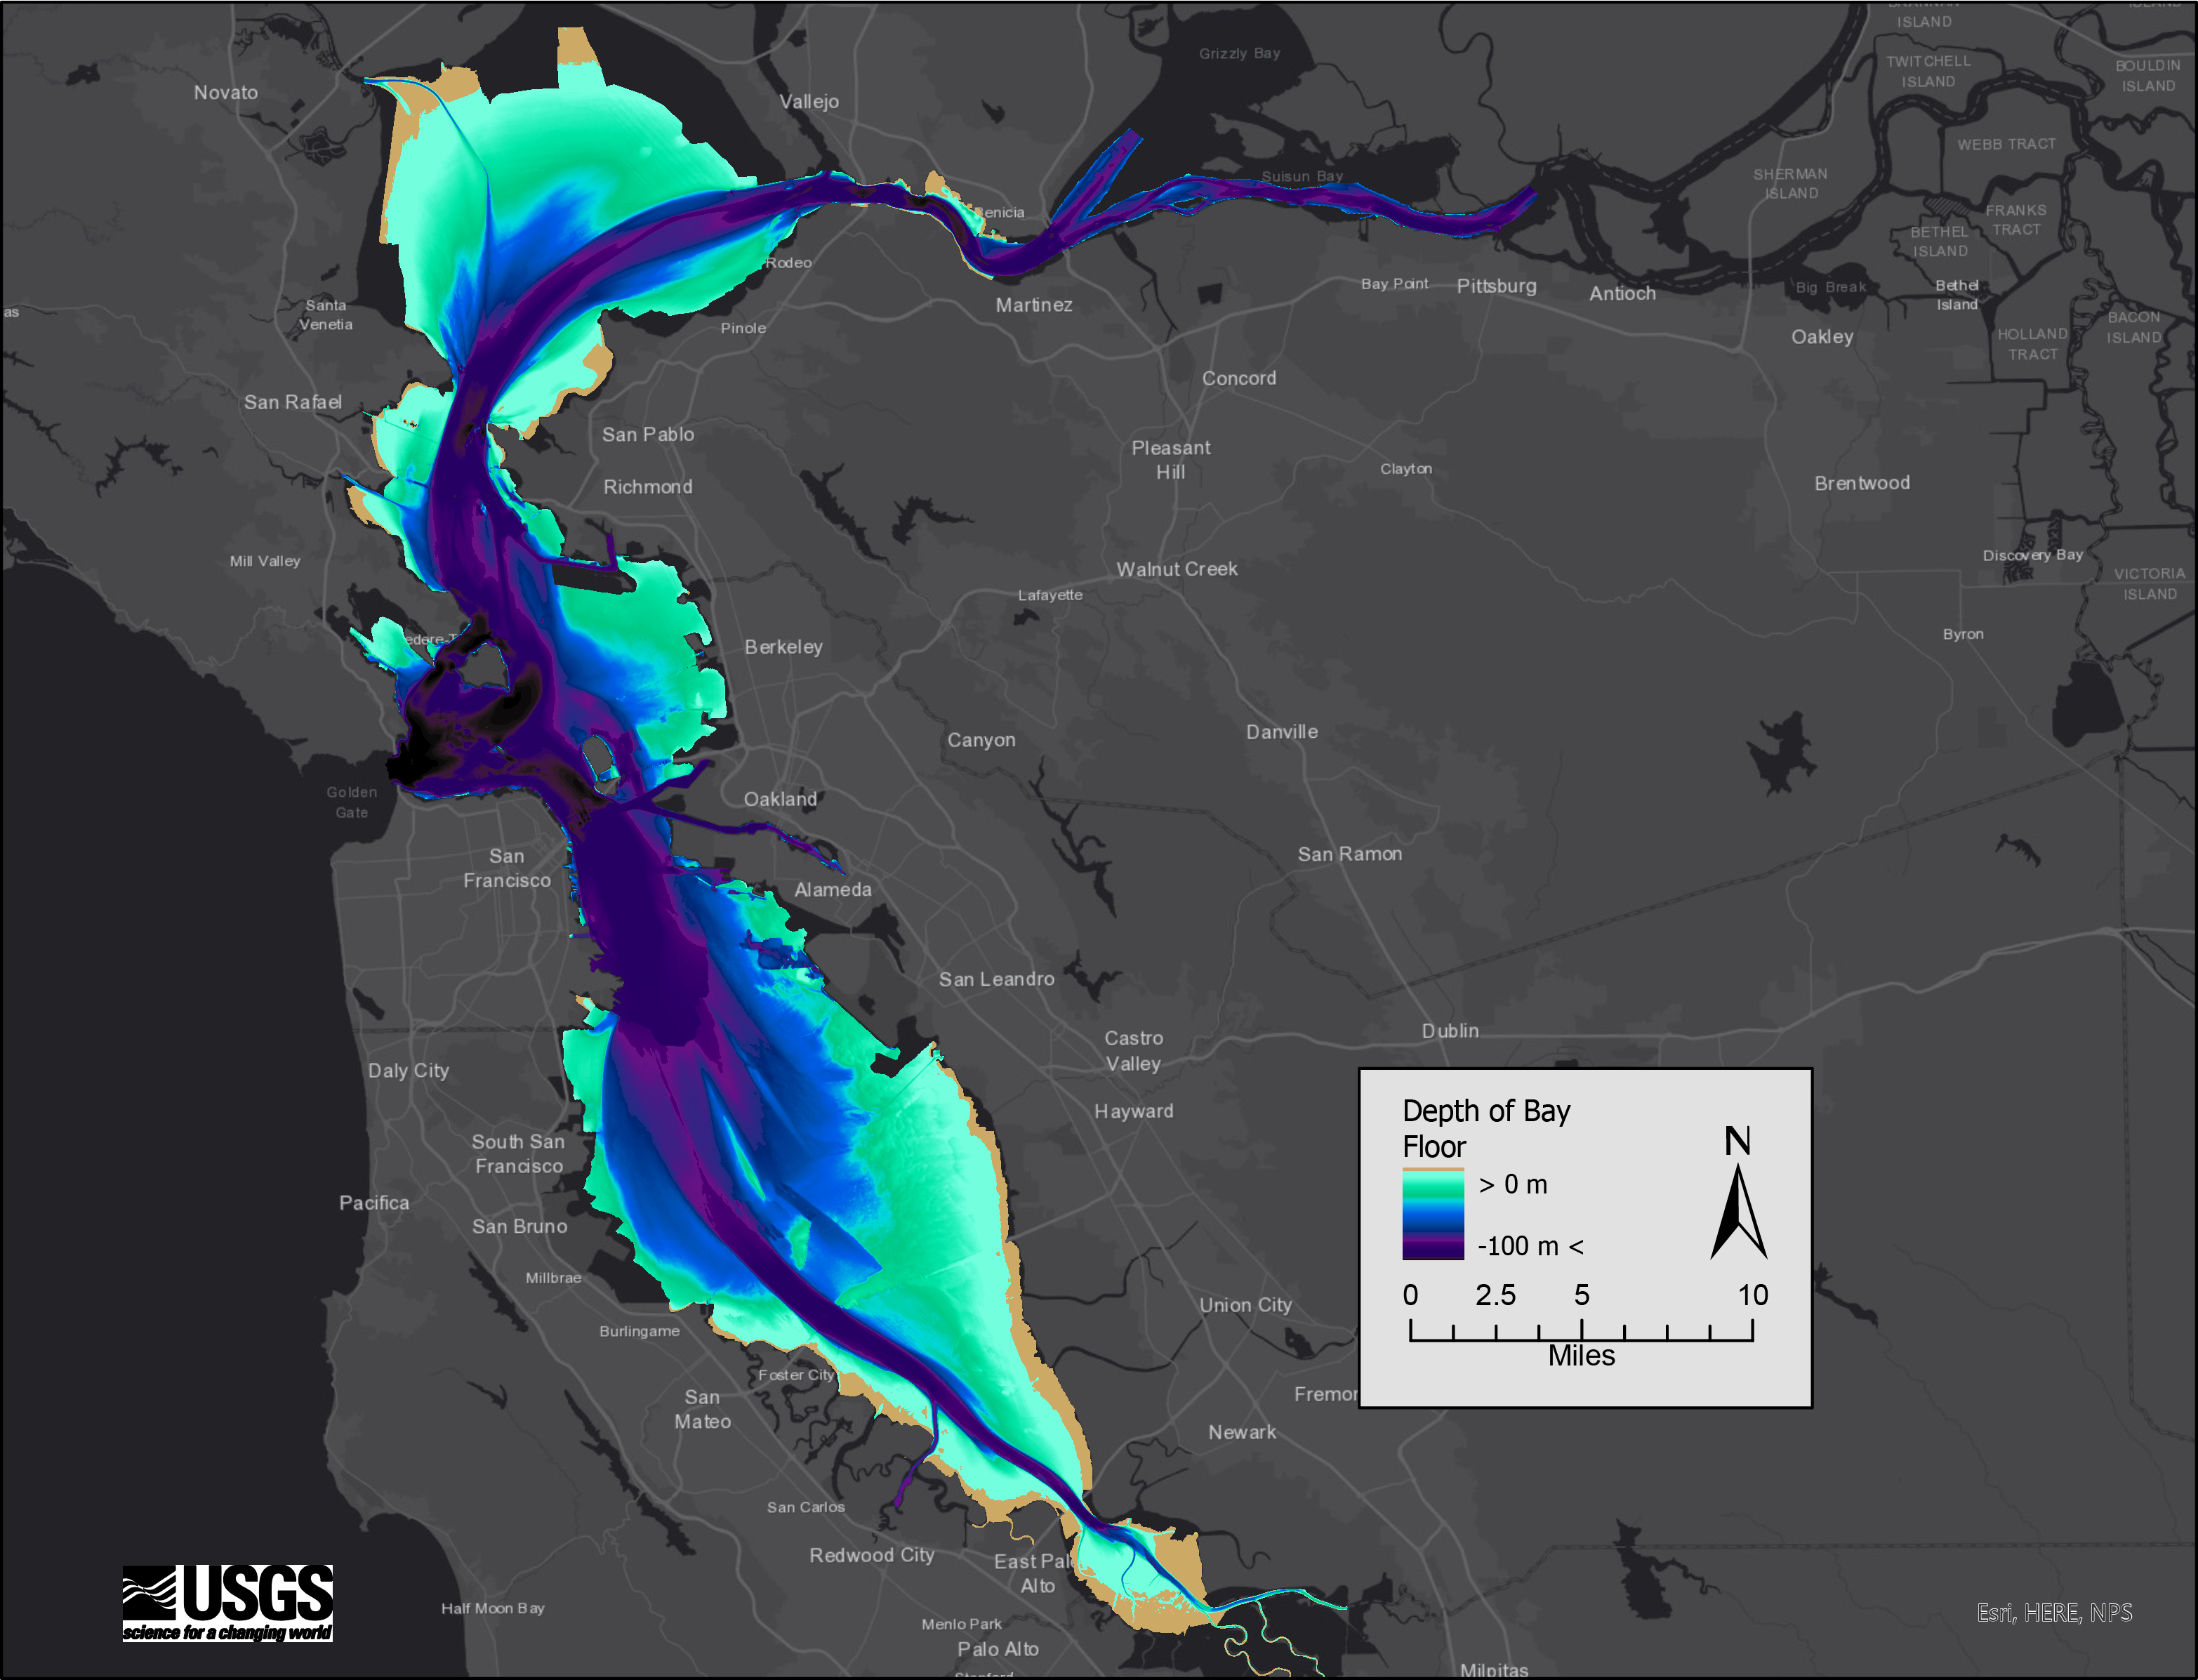
One foundational piece of this research is work currently underway by the U.S. Geological Survey’s Bruce Jaffe to update our picture of the state and shape of the bottom of the Bay: its actual bathymetry. Jaffe’s last study in the 2000s concluded among other things that the Bay was eroding in the north and depositing in the far south before the 1980s. Such conclusions may change considerably once he factors in new data from the last 35 years.
Early version of bathymetric surface. Final version to be released this April.. Source Theresa Fregoso, USGS
“Getting that bathymetry update will be a gamechanger,” says McKee. “The old period no longer fits current conditions or the modern management timeline.” At a macro level, this new bathymetry and sediment budget will be more “spatially explicit,” providing more detail on specific parts of the Bay that local decision-makers and stakeholders can use to fine-tune their restoration and habitat protection plans, as well as dredging and sand mining permits, he says.
Figuring out how much sediment is going in and out of the Golden Gate is another priority, though it requires sending vessels out after a big storm to measure sediment concentrations in very deep, choppy conditions while dodging container ships and tankers. Estuary News covered this a few years ago, when scientists on the RV Questuary tracked a plume of sediment released from 2017 flooding the Delta’s Yolo Bypass, finding that some of it got stuck in San Pablo Bay and never made it out the Golden Gate. Future studies have to remain reactive to rainfall, but the RMP plans for that, says McKee.
Another gap is understanding exactly how sediment moves around the edge of marshes and mudflats, and what vegetation contributes to this dynamic. Which is partly why the RMP sediment workgroup chose to fund a study by two USGS scientists on that subject first.
“I joke that they let an ecologist into a room with a hydrologist and look what happened,” says Karen Thorne, who was teamed with colleague Jessica Lacy for the first time in their careers to do the study. “There was a lot of back-and-forth between managers and scientists on how we could crosswalk our disciplines around sediment.”
“The result is a much stronger and more strategic study,” says Lacy.
Field researchers navigate shallow sloughs. Photo: USGS
For a study site, the two scientists chose Whale’s Tail Marsh near Hayward. The marsh is not only in the sediment-rich South Bay, but also surrounded by Eden Landing wetland restoration sites competing for the future sediment supply. More importantly, it’s eroding rapidly, with 10 meters of shoreline retreat between 2004 and 2010 according to satellite surveys (LIDAR). Lacy had already studied a sheltered marsh on the Marin Bayshore with a depositional edge. For contrast, she wanted one that is eroding and retreating as winds gathering across the long fetch of the South Bay shallows drive waves against shore, scalloping and undercutting the marsh edge.
The workgroup also wanted to finally get some real data showing how marshes buffer urban shorelines from waves. “Land managers want to use green methods of shoreline protection but they aren’t convinced the data is there yet to show it works,” says Lacy.
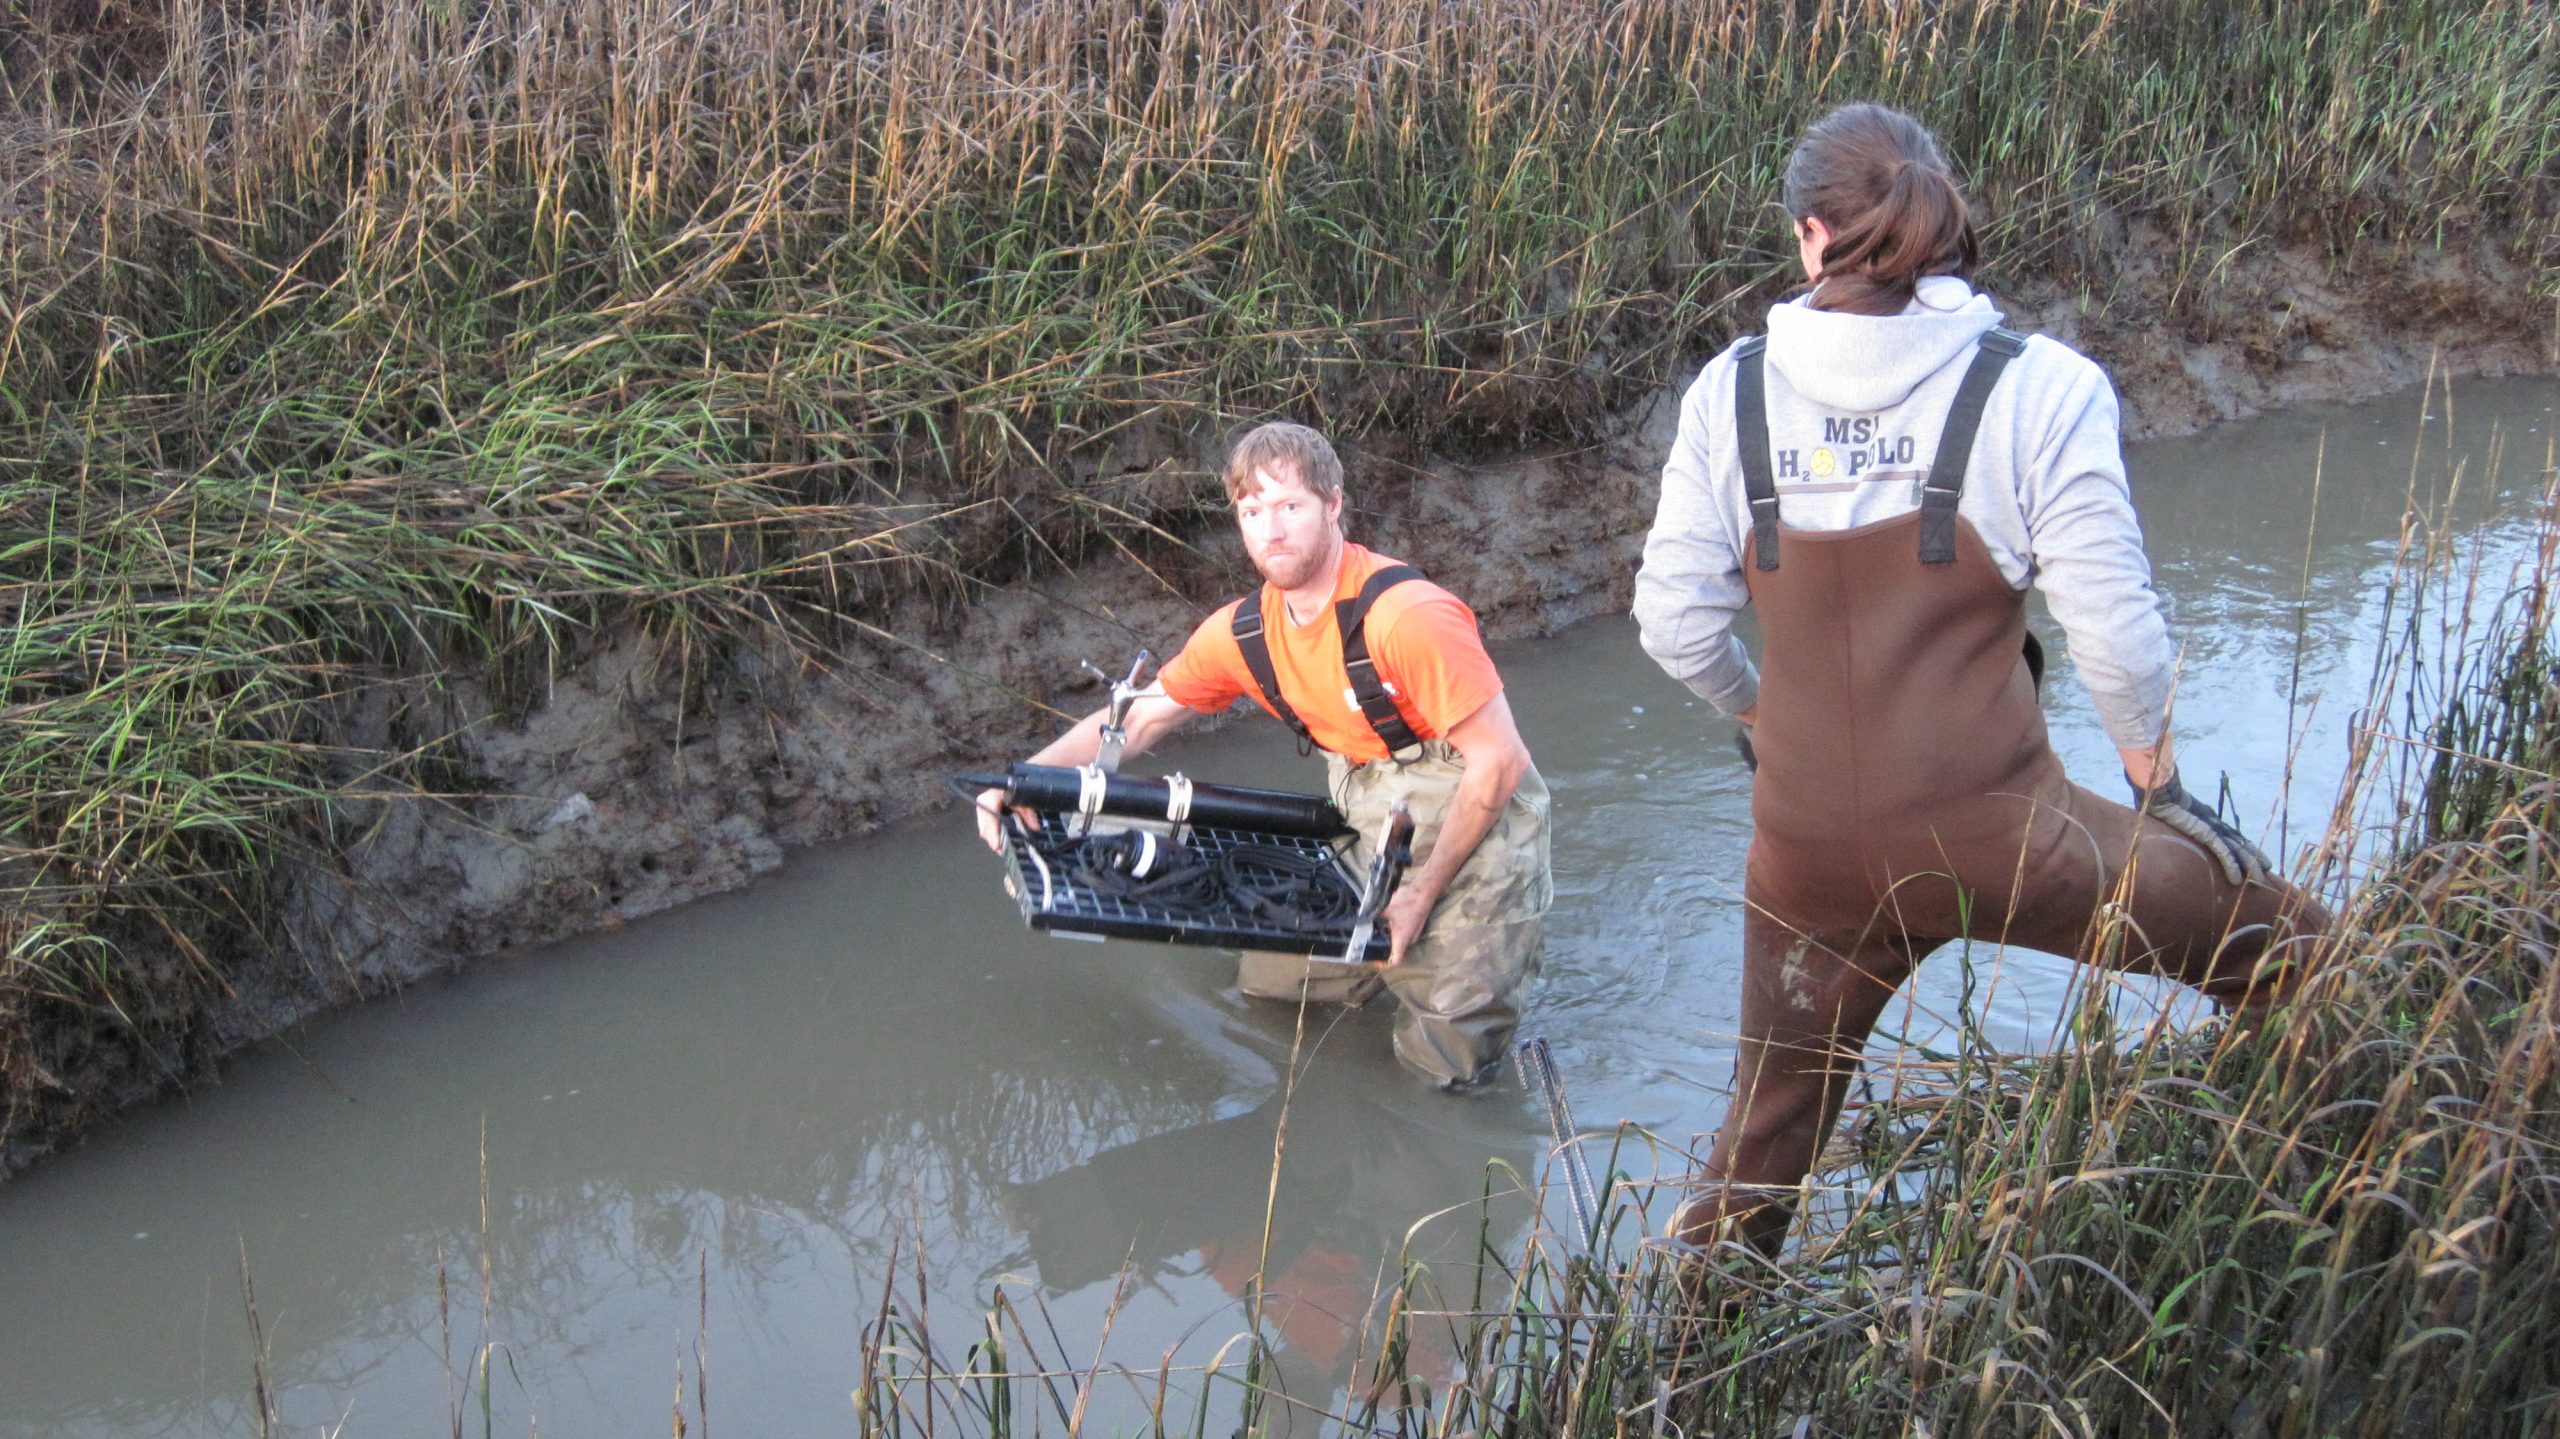
Lacy will measure winds, waves, and sediment movement using instruments placed in Bay shallows and on the marsh surface for weeks at a time and then retrieved, storing all their data on a chip. The biggest problem is fouling of the sensors. “The instruments are out all day in the sun or underwater. Plants get hung up on them, algae grows over them, birds poop on them, all of which can mess up the data stream,” says Lacy. Luckily there’s been a revolution in the technology. “They now have mechanical wipers, like toothbrush heads, that scour the surface every couple of hours,” she says.
Tiles placed on the marsh surface to measure sediment accumulation as tides advance and retreat. Photo: USGS
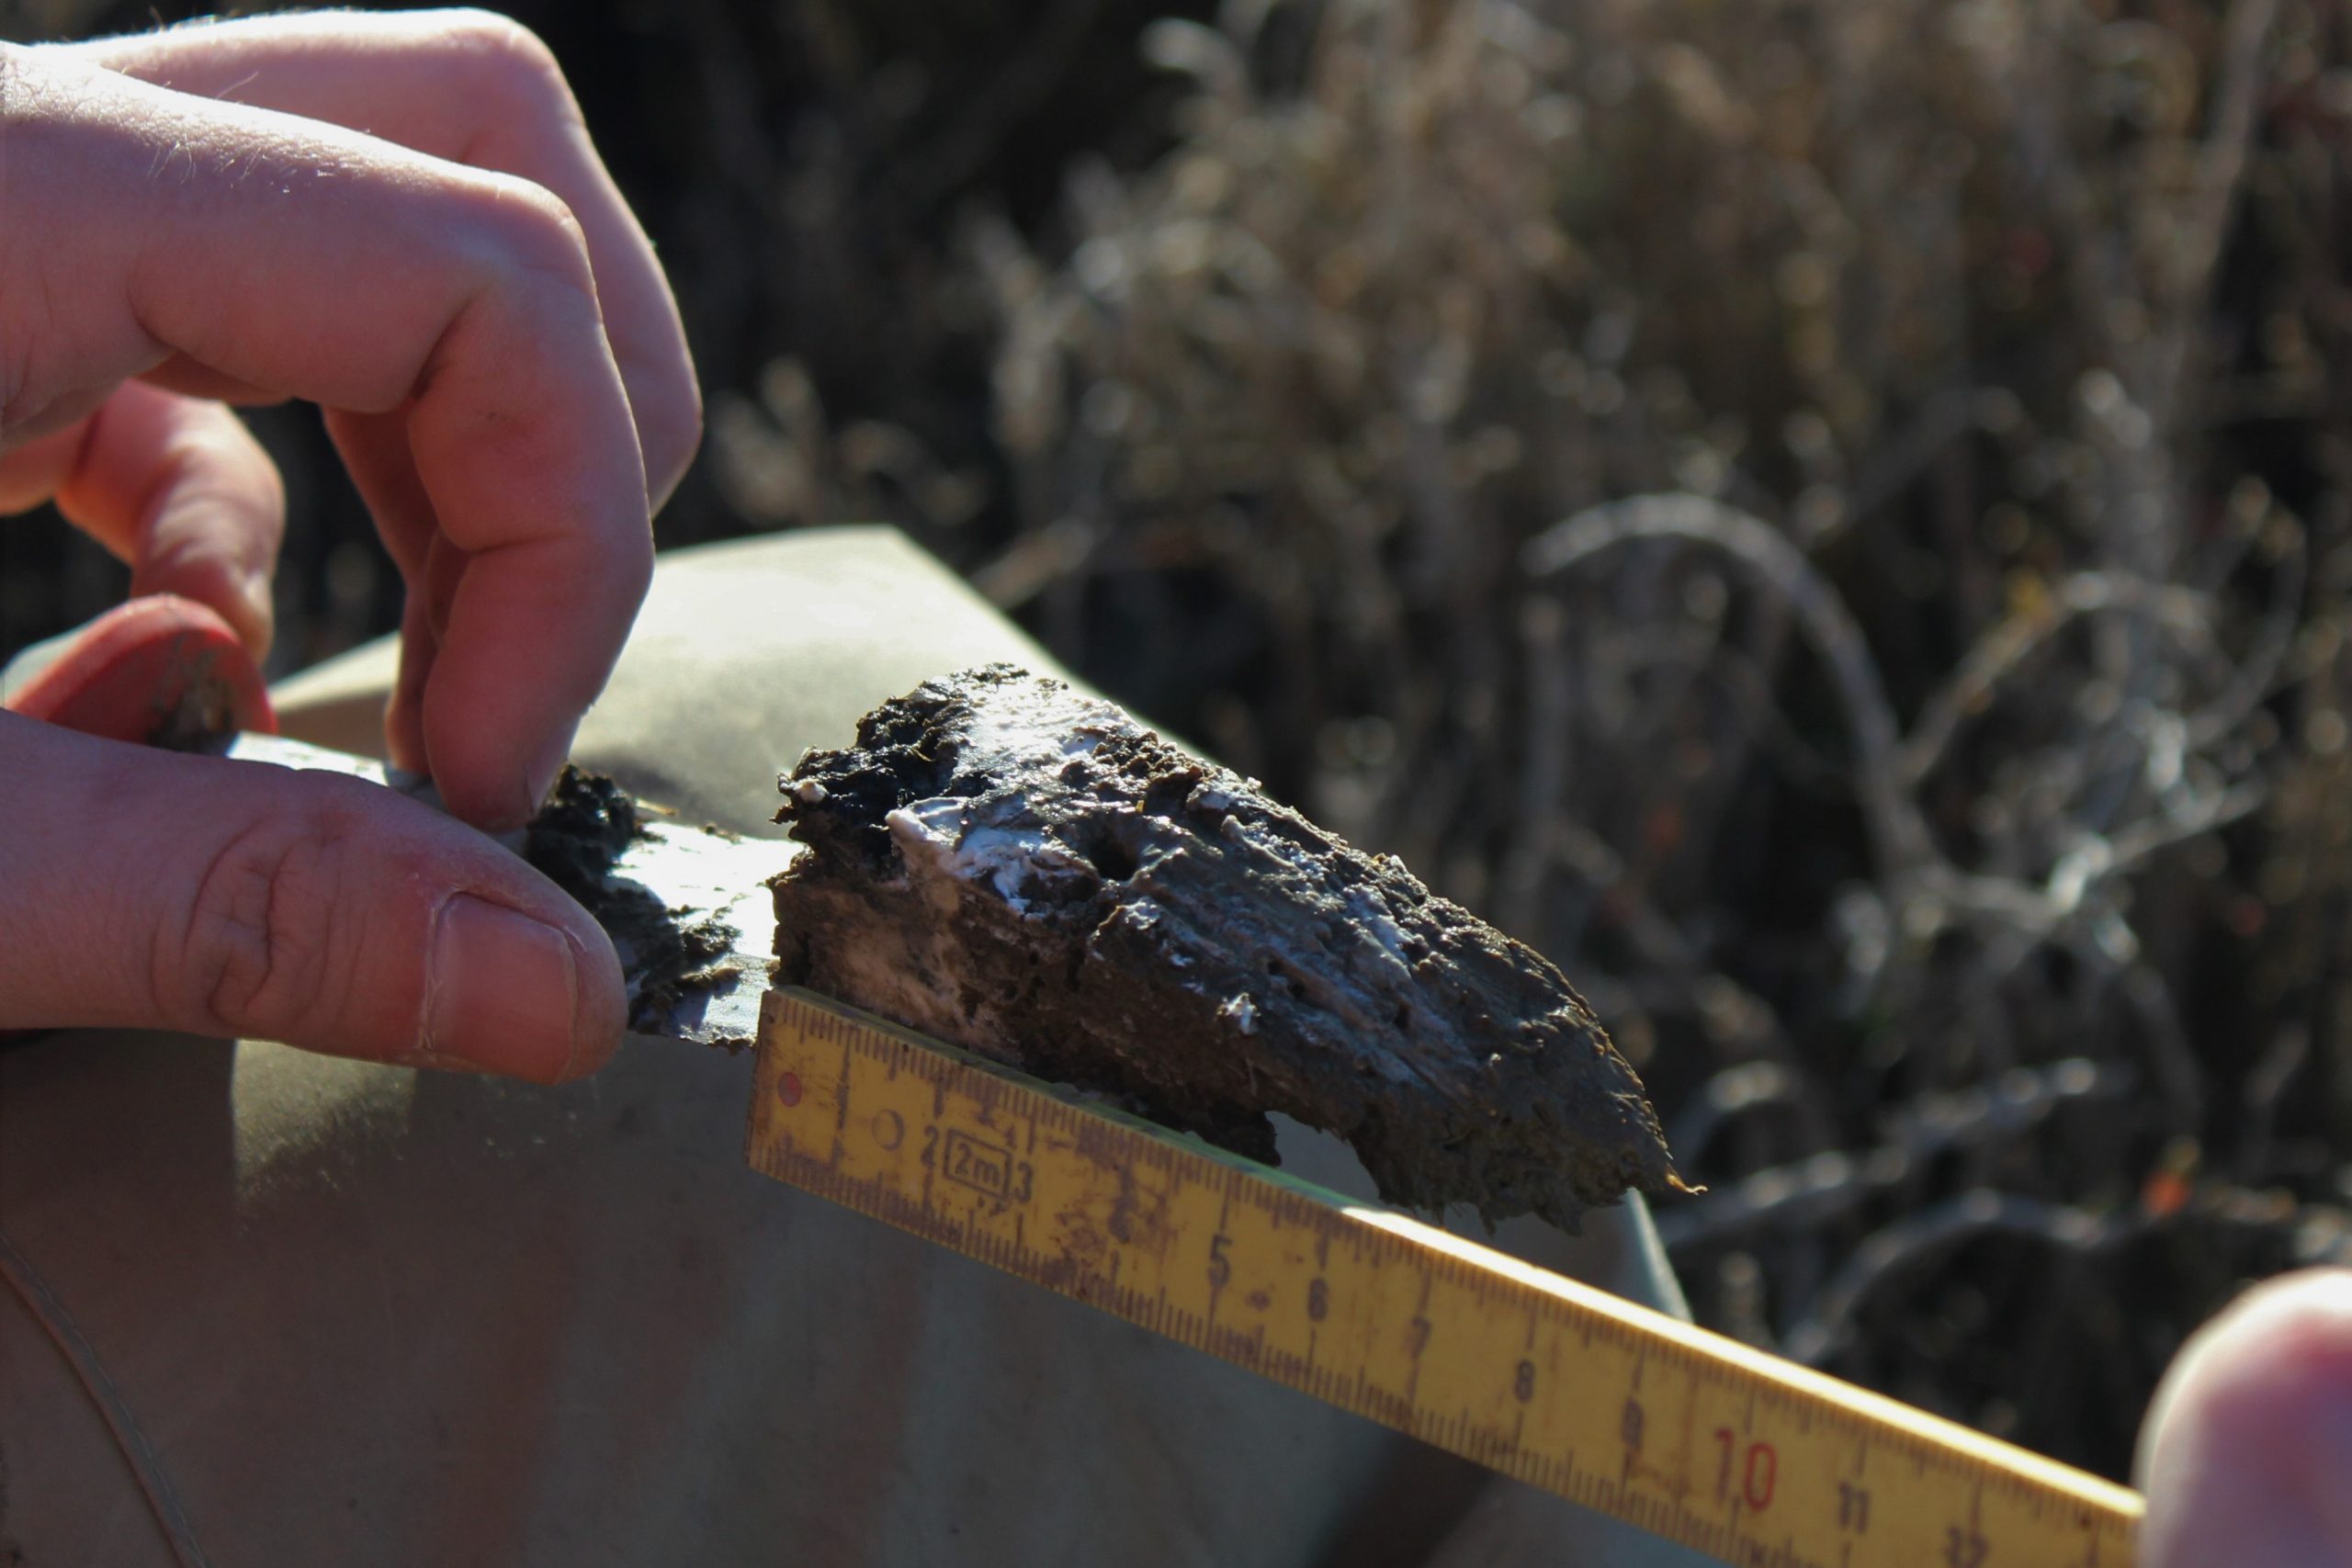
Thorne will be setting out small tiles, like those on your bathroom wall, amid the pickleweed and cordgrass to tease out the vegetation part of the sediment equation. “Every few weeks or months, we’ll collect them, take them back to the lab, then dry and weigh the sediment and organic material that has settled out. We’ll probably see less the farther the tiles were inland from the Bay,” says Thorne. (Hear more on the study from the new Science-in-Short Podcast Marsh Mud on the Move, publishing March 30).
Other recommendations for closing knowledge gaps range from placing sediment monitoring stations in at least two key tributaries within each of the fringing counties to exploring sediment dynamics at key boundaries such as bridges between smaller bays within San Francisco Bay (sub-embayments). Sediment monitoring at four new tributaries has already started on Belmont Creek, Novato Creek, and Arroyo Corte Madera del Presidio, and is planned for Walnut Creek starting October 2021 (see map). These sites are upstream from marshes of interest and also address data gaps from a watershed monitoring and modeling perspective. Meanwhile, a USGS study is just wrapping up that will improve our understanding of sediment passing through the Carquinez Strait. All this research is funded using fines for environmental pollution overseen by the RMP.
New sediment monitoring sites on Bay tributaries. Source: RMP/SFEI
“Sediment science is so darn complicated,” says Brenda Goeden, sediment manager for the San Francisco Bay Conservation and Development Commission (BCDC). “It’s well studied, but less well understood.”
Some of the data collected under the new strategy or pulled from other research is destined to end up in computer models. McKee describes this next generation of models as “more process-based,” taking into account erosion and deposition, or system “awakenings” in which long-term calm or dry conditions are interrupted by atmospheric-river downpours or earthquakes or El Niños, releasing sudden pulses of sediment.
It is this combination of strategic data collection and modeling that the strategy describes and that will most cost-effectively help us to learn more about the Bay. It’s just too expensive to measure everything, everywhere, all the time, but models will help fill in some of the remaining gaps in our knowledge, and help teach us where else to focus monitoring efforts.
McKee also describes the evolving models as of “higher resolution,” and offering a clearer direction for sediment managers trying to choose whether to capture sediment from creek mouths, or place sediment in the shallows to feed adjacent marshes, or import dredged sediment or construction material to raise their shores. They also will need to know when to move it — high tide or low, wet year or dry — and how big the grain size should be for best results.
“There are a lot of knobs and dials we can turn to manage sediment in the Estuary,” says the Water Board’s Christina Toms, science lead for another regional monitoring initiative aimed at tracking wetland health. “We need to know which give us the most bang for the buck.”
One place to get more bang is the hundreds of small watersheds draining from the Bay Area hills into the Bay, carrying sediment along the way. “We need to build more healthy, robust connections between streams and the Estuary,” says Toms.
Another place to look for watershed bang is in science integration. “We need to get the people working at the head of tide to look upstream and those up in the watershed to look downstream,” says Dusteroff. “We need to find the sweet spot where we manage watersheds so that we get fine sediment out to baylands but not so much that it causes problems for spawning salmonids.”
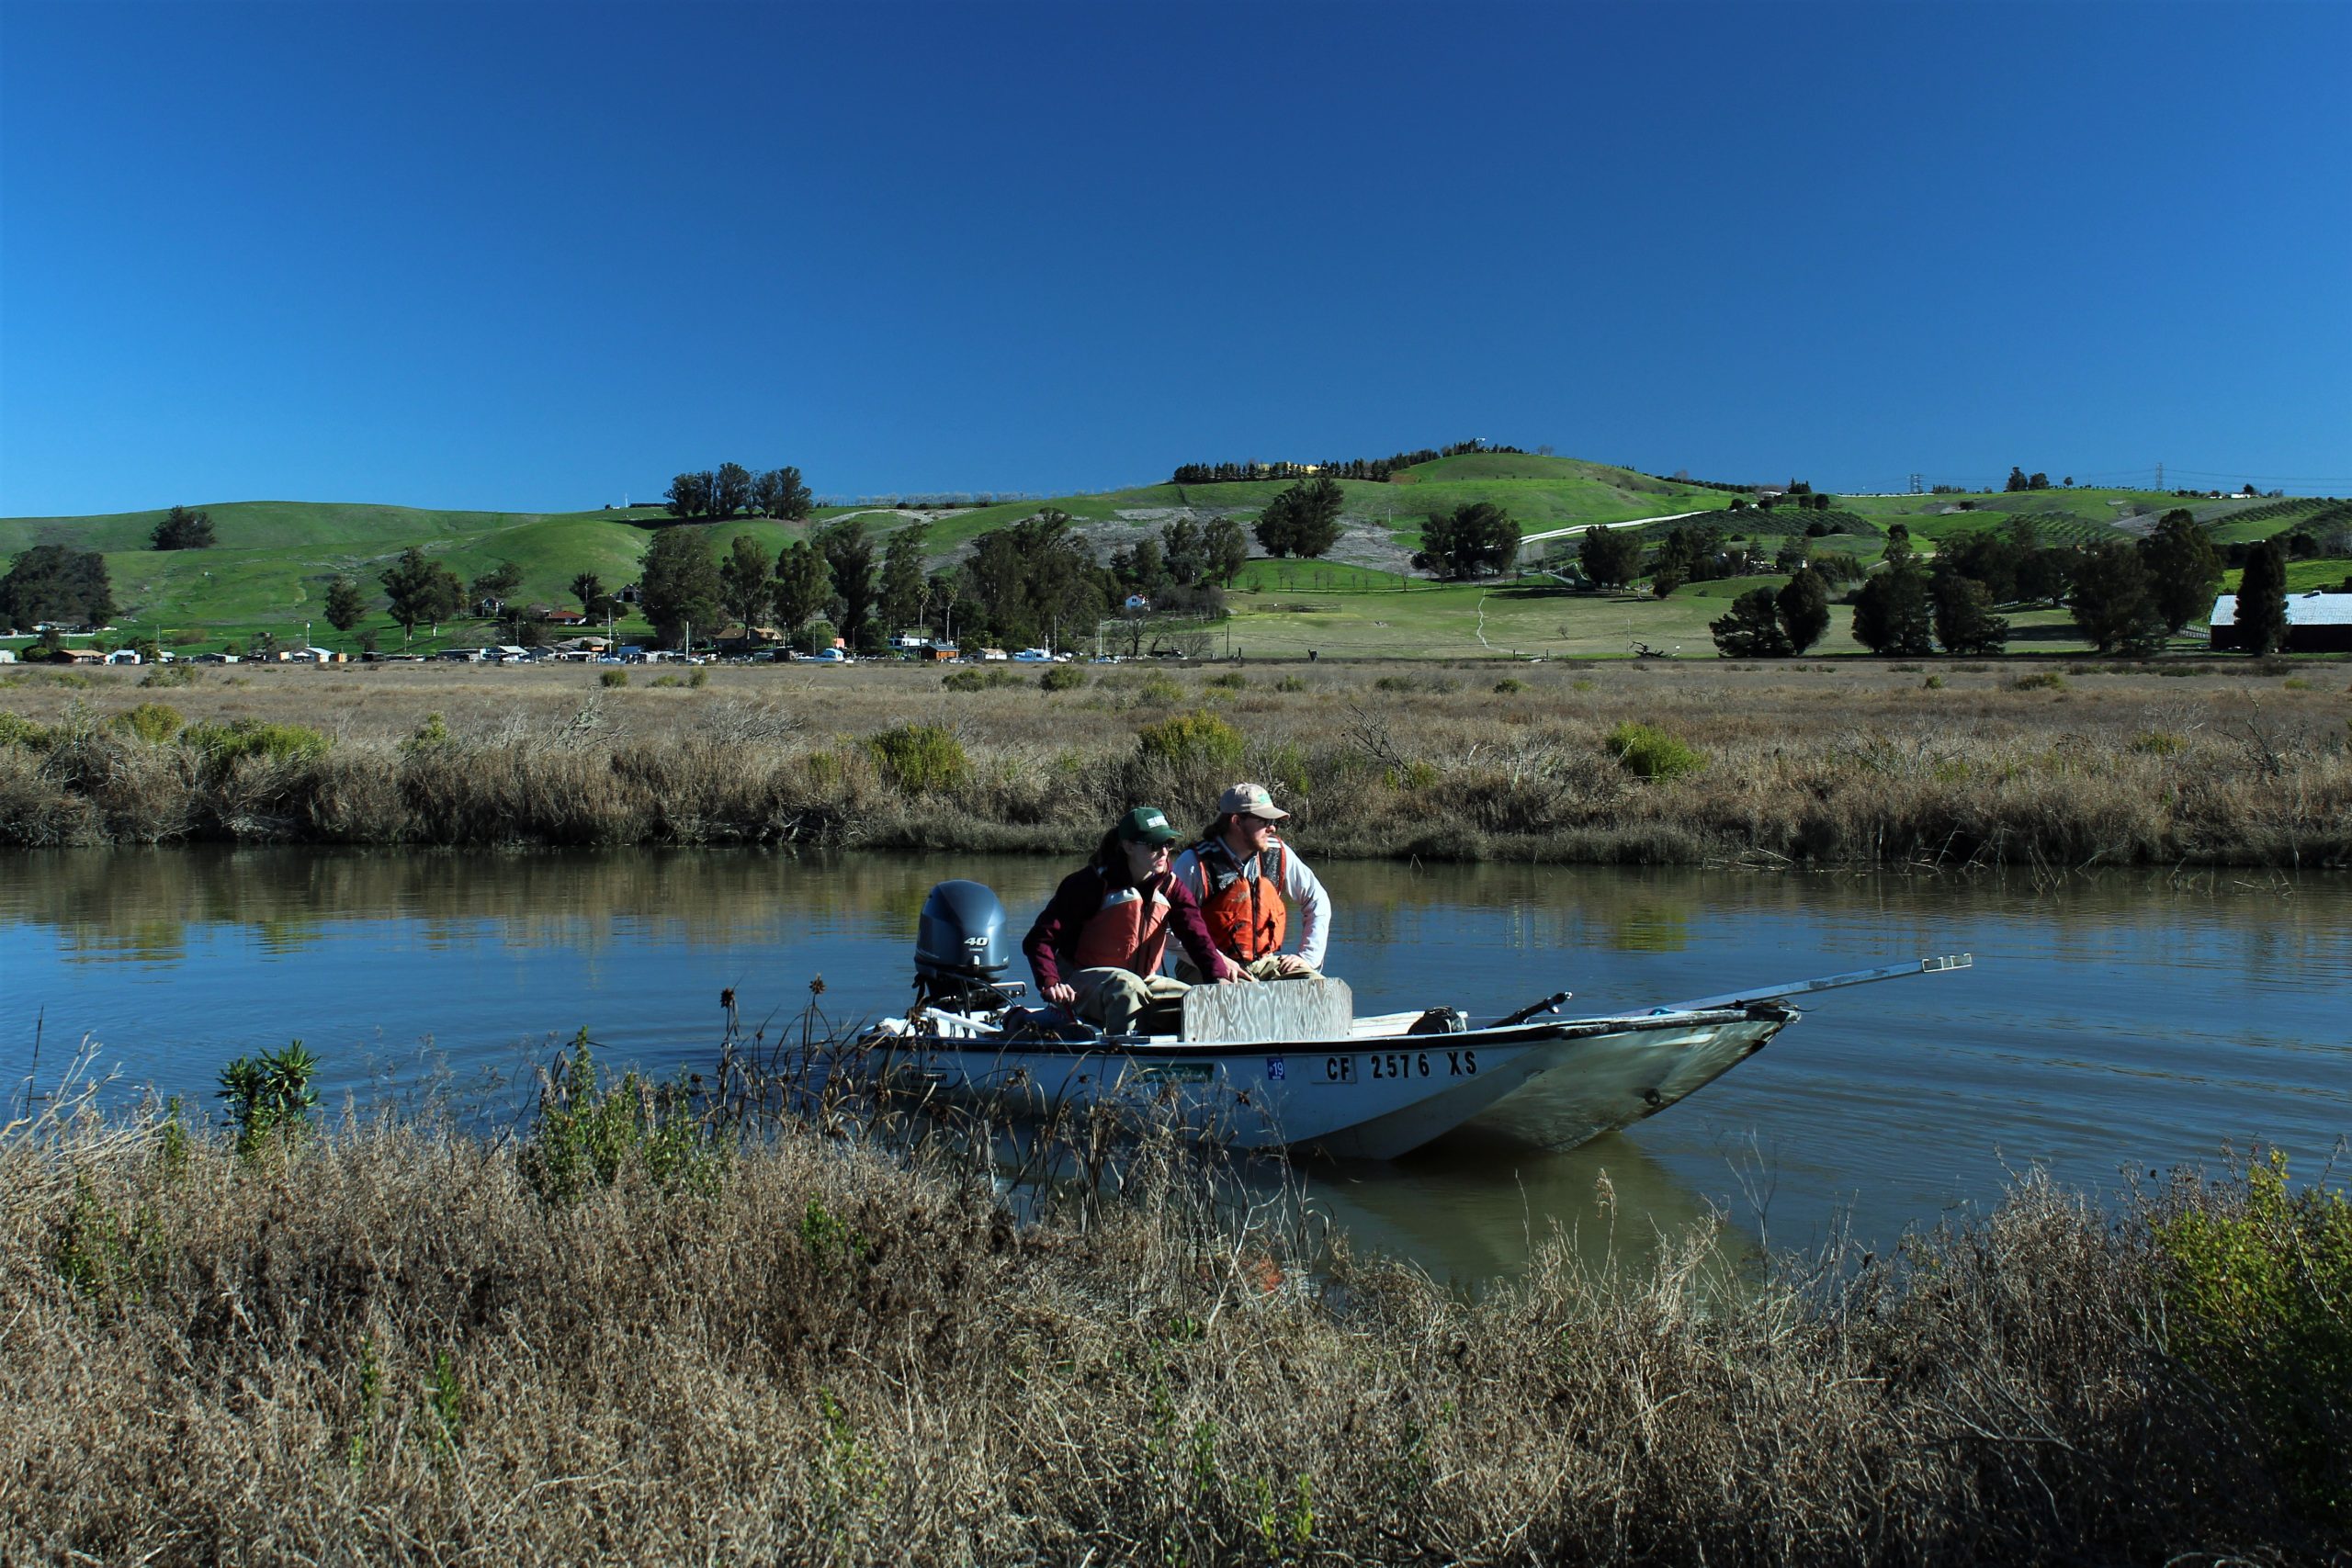
Tim Elfers (USGS) and Anna Deck (SFBay NERR) deploy instruments in a tidal creek to measure suspended-sediment concentration and current velocity. Photo: Jessie Lacy
Another consideration in terms of bang for the work done under the new sediment monitoring and modeling strategy is to answer the questions of those who are updating regulations. BCDC has already produced a regional sediment management plan (2016) and amended its prohibitions on Bay fill to allow for some placement in the Bay for shoreline adaptation purposes, and learning more about sand-sized or “coarse” material is a new research focus for the commission. The Water Board, meanwhile, is working on a basin plan amendment to address a similar disconnect between old rules and new needs, which is due out in 2022.
Both regulators continue to tangle with a longstanding worry that sediments from some sites are contaminated and should never be dumped in a pristine marsh no matter how fast it is eroding.
“We have to rebalance the two risks, the known risk of wetlands drowning from sea-level rise against the potential impacts of contamination from sediments,” says the Water Board’s Fernandez. “A little higher level of contamination may not have as big an impact on wildlife as loss of habitat.” The screening process for sediment cleanliness is one policy that could be revisited, as well as guidelines to ensure “dirtier” sediments are safely capped with clean material when placed in new environments.
Fernandez adds “We have to sync up our permitting with ecological processes — keeping something static isn’t relevant to current and future conditions.”
Tubes of the amphipod Ampelisca abdita, protruding from small sediment cores. Photo: USGS
Climate change is challenging all kinds of regulatory assumptions on many levels. “One thing I really appreciate about the overall sediment strategy is they’re beginning to tackle the question of what drier and wetter futures mean for sediment supply and watershed flows,” says the Water Board’s Toms.
This spring, SFEI will release much-anticipated regional sediment supply and demand scenarios under drier and wetter futures. Meanwhile, the urgency around rapidly rising sea levels, and supporting our marshes and buffer zones, has made sediment a celebrity and monitoring and modeling its movements a magnet for the science paparazzi. The stepped-up scrutiny promises to answer the urgency with better clarity.
“The RMP is a systematic program that doesn’t do things by accident; it goes through periods of hyper-planning that might seem cumbersome but helps us be careful and collaborative about how we use limited resources,” says McKee. “When we embark on a new endeavor, we are not just doing people’s pet projects. We’re choosing to do what’s most pertinent to the public at large, maintaining our Bay and shorelines for the community of the future. Plus, if we only did the easy things, we’d be bored.”
Ariel Rubissow Okamoto is both today’s editor-in-chief and the founding editor of ESTUARY magazine (1992-2001). She enjoys writing in-depth, silo-crossing stories about water, restoration, and science. She’s a co-author of a Natural History of San Francisco Bay (UC Press 2011), frequent contributor of climate change stories to Bay Nature magazine, and occasional essayist for publications like the San Francisco Chronicle (see her Portfolio here). In other lives, she has been a vintner, soccer mom, and waitress. She lives in San Francisco close to the Bay with her architect husband Paul Okamoto.
Our magazine’s media motto for many years has been “Where there’s an estuary, there’s a crowd.” The San Francisco Estuary is a place where people, wildlife, and commerce congregate, and where watersheds, rivers and the ocean meet and mix, creating a place of unusual diversity. In choosing to tell the...
Ever since the state and federal water projects were built in the 1930s and 1940s, California has captured snowmelt in foothill reservoirs, and moved the fresh water from dam releases and river outflows to parched parts of the state via aqueducts hundreds of miles long. A convoluted system of ancient...
Though the Clean Water Act did an amazing job of reducing wastewater and stormwater pollution of the San Francisco Estuary, some contaminants remain thorny problems. Legacy pollutants like mercury washed into the watershed from upstream gold mining, PCBs from old industrial sites, and selenium from agricultural drainage in the San...
Hothouse Earth
By Ariel Rubissow Okamoto
Photo by Megan Nguyen
Nothing could be stranger than sitting in the dark with thousands of suits and heels, watching a parade of promises to decarbonize from companies and countries large and small, reeling from the beauties of big screen rainforests and indigenous necklaces, and getting all choked up.
It was day two of the September 2018 Global Climate Action Summit in San Francisco when I felt it.
At first I wondered if I was simply starstruck. Most of us labor away trying to fix one small corner of the planet or another without seeing the likes of Harrison Ford, Al Gore, Michael Bloomberg, Van Jones, Jerry Brown – or the ministers or mayors of dozens of cities and countries – in person, on stage and at times angry enough to spit. And between these luminaries a steady stream of CEOs, corporate sustainability officers, and pension fund managers promising percentages of renewables and profits in their portfolios dedicated to the climate cause by 2020-2050.
I tried to give every speaker my full attention: the young man of Vuntut Gwichin heritage from the edge of the Yukon’s Arctic National Wildlife Refuge who pleaded with us not to enter his sacred lands with our drills and dependencies; all the women – swathed in bright patterns and head-scarfs – who kept punching their hearts. “My uncle in Uganda would take 129 years to emit the same amount of carbon as an American would in one year,” said Oxfam’s Winnie Byanyima.
“Our janitors are shutting off the lights you leave on,” said Aida Cardenas, speaking about the frontline workers she trains, mostly immigrants, who are excited to be part of climate change solutions in their new country.
The men on the stage, strutting about in feathers and pinstripes, spoke of hopes and dreams, money and power. “The notion that you can either do good or do well is a myth we have to collectively bust,” said New Jersey Governor Phil Murphy whose state is investing heavily in offshore wind farms.
“Climate change isn’t just about risks, it’s about opportunities,” said Blackrock sustainable investment manager Brian Deese.
But it wasn’t all these fine speeches that started the butterflies. Halfway through the second day of testimonials, it was a slight white-haired woman wrapped in an azure pashmina that pricked my tears. One minute she was on the silver screen with Alec Baldwin and the next she taking a seat on stage. She talked about trees. How trees can solve 30% of our carbon reduction problem. How we have to stop whacking them back in the Amazon and start planting them everywhere else. I couldn’t help thinking of Dr. Seuss and his truffala trees. Jane Goodall, over 80, is as fierce as my Lorax. Or my daughter’s Avatar.
Analyzing my take home feeling from the event I realized it wasn’t the usual fear – killer storms, tidal waves, no food for my kids to eat on a half-baked planet – nor a newfound sense of hope – I’ve always thought nature will get along just fine without us. What I felt was relief. People were actually doing something. Doing a lot. And there was so much more we could do.
As we all pumped fists in the dark, as the presentations went on and on and on because so many people and businesses and countries wanted to STEP UP, I realized how swayed I had let myself be by the doomsday news mill.
“We must be like the river, “ said a boy from Bangladesh named Risalat Khan, who had noticed our Sierra watersheds from the plane. “We must cut through the mountain of obstacles. Let’s be the river!”
Or as Harrison Ford less poetically put it: “Let’s turn off our phones and roll up our sleeves and kick this monster’s ass.”
4th California Climate Change Assessment Blues
by Isaac Pearlman
Since California’s last state-led climate change assessment in 2012, the Golden State has experienced a litany of natural disasters. This includes four years of severe drought from 2012 to 2016, an almost non-existent Sierra Nevada snowpack in 2014-2015 costing $2.1 billion in economic losses, widespread Bay Area flooding from winter 2017 storms, and extremely large and damaging wildfires culminating with this year’s Mendocino Complex fire achieving the dubious distinction of the largest in state history. California’s most recent climate assessment, released August 27th, predicts that for the state and the Bay Area, we can expect even more in the future.
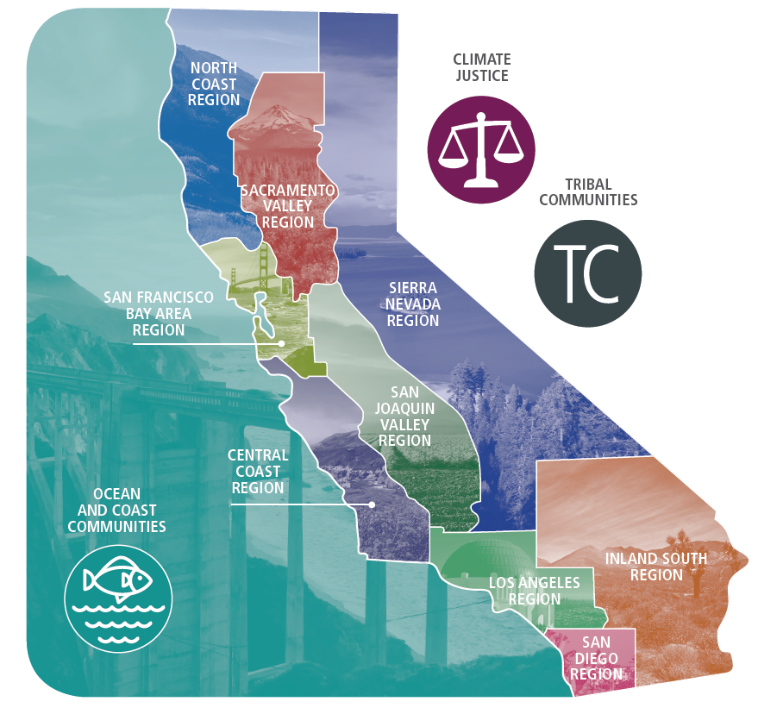
The California state government first began assessing climate impacts formally in 2006, due to an executive order by Governor Schwarzenegger. California’s latest iteration and its fourth overall, includes a dizzying array of 44 technical reports; three topical studies on climate justice, tribal and indigenous communities, and the coast and ocean; as well as nine region-specific analyses.
The results are alarming for our state’s future: an estimated four to five feet of sea level rise and loss of one to two-thirds of Southern California beaches by 2100, a 50 percent increase in wildfires over 25,000 acres, stronger and longer heat waves, and infrastructure like airports, wastewater treatment plants, rail and roadways increasingly likely to suffer flooding.
For the first time, California’s latest assessment dives into climate consequences on a regional level. Academics representing nine California regions spearheaded research and summarized the best available science on the variable heat, rain, flooding and extreme event consequences for their areas. For example, the highest local rate of sea level rise in the state is at the rapidly subsiding Humboldt Bay. In San Diego county, the most biodiverse in all of California, preserving its many fragile and endangered species is an urgent priority. Francesca Hopkins from UC Riverside found that the highest rate of childhood asthma in the state isn’t an urban smog-filled city but in the Imperial Valley, where toxic dust from Salton Sea disaster chokes communities – and will only become worse as higher temperatures and less water due to climate change dry and brittle the area.
According to the Bay Area Regional Report, since 1950 the Bay Area has already increased in temperature by 1.7 degrees Fahrenheit and local sea level is eight inches higher than it was one hundred years ago. Future climate will render the Bay Area less suitable for our evergreen redwood and fir forests, and more favorable for tolerant chaparral shrub land. The region’s seven million people and $750 billion economy (almost one-third of California’s total) is predicted to be increasingly beset by more “boom and bust” irregular wet and very dry years, punctuated by increasingly intense and damaging storms.
Unsurprisingly, according to the report the Bay Area’s intensifying housing and equity problems have a multiplier affect with climate change. As Bay Area housing spreads further north, south, and inland the result is higher transportation and energy needs for those with the fewest resources available to afford them; and acute disparity in climate vulnerability across Bay Area communities and populations.
“All Californians will likely endure more illness and be at greater risk of early death because of climate change,” bluntly states the statewide summary brochure for California’s climate assessment. “[However] vulnerable populations that already experience the greatest adverse health impacts will be disproportionately affected.”
“We’re much better at being reactive to a disaster than planning ahead,” said UC Berkeley professor and contributing author David Ackerly at a California Adaptation Forum panel in Sacramento on August 27th. “And it is vulnerable communities that suffer from those disasters. How much human suffering has to happen before it triggers the next round of activity?”
The assessment’s data is publicly available online at “Cal-adapt,” where Californians can explore projected impacts for their neighborhoods, towns, and regions.


 The results are alarming for our state’s future: an estimated four to five feet of sea level rise and loss of one to two-thirds of Southern California beaches by 2100, a 50 percent increase in wildfires over 25,000 acres, stronger and longer heat waves, and infrastructure like airports, wastewater treatment plants, rail and roadways increasingly likely to suffer flooding.